Breaking Down Silos: Integrating Cross-Channel Data in Your Marketing Dashboard
A Marketing Reporting Dashboard is a revolutionary tool for marketers in today's data-rich landscape. Here's why: Marketing teams often face a challenge known as "data silos," where information is trapped in different locations and platforms.
A survey revealed that to handle campaigns and data, marketers use an average of over 12 distinct Data Management Software, and some use an even higher number—more than 31.
To overcome this challenge, marketers can integrate cross-channel data from diverse sources and platforms, overcoming limitations in connectivity, metrics, and features. But what exactly is Cross-Channel Marketing?Let's go deeper to uncover the answer.
Understanding Cross-Channel Marketing
Cross-channel marketing is a method that reaches and engages customers at every stage of their journey by using a variety of channels, including social media, web platforms, and email.
For example, the data from Instagram, YouTube, and Facebook is scattered in different formats and places for marketing purposes. This approach, while effective, often leads to fragmented data, making it challenging to create a cohesive marketing strategy. The solution lies in a robust Dashboard tool that can assimilate data from these varied sources into a unified view.
A Marketing Reporting Dashboard, specifically, breaks down data silos by pulling real-time data from various sources and presenting it cohesively for quick and informed decisions.
Data Silos: The Barrier to Integration
Data silos are like separate islands of information in a company. Each team has its own data and can't easily share it. This happens when there's insufficient technology or teams grow too fast. These silos can make the Marketing Reporting dashboard less efficient because teams can't work together, and it can also lead to problems with data quality. It's like having pieces of a puzzle, but without a holistic view of data, marketing teams might make decisions based on incomplete or outdated information, leading to less effective marketing strategies and a potential waste of resources.
For example, Edit Suit Co, specializing in custom menswear, faced data challenges during expansion. Grow, a unified platform, consolidated data across marketing, sales, operations, and customer service, providing real-time inventory insights. These efficiently tackled data management issues, earning praise for its scalable, unlimited user model and enhancing customer satisfaction for seamless growth.
Strategies for Breaking Down Silos
Best practices for data governance and management.
To break down silos in a company and make things work better, the first step is to organize and take control of all the information. This means putting data in one central place like the Dashboard tool, ensuring it's of good quality, and keeping it safe. Also, teams should work together towards common goals, especially in customer care and marketing on digital platforms.
This includes having clear rules and responsibilities, ensuring everyone follows the same standards, and doing regular checks to ensure data is good.
Unifying Teams: Strategies for a Shared Data Approach
Technology that helps integrate, automate, and analyze data is also essential. When different teams and departments follow a standard data management plan (a unified data strategy), it helps everyone speak the same language and make data-based decisions. Marketers should explain the benefits of this strategy, involve people from different parts of the company, and encourage a culture where everyone works together.
Leadership's Role in Cultivating a Data-Integrated Culture
Leaders in the company play a significant role in ensuring everyone works well with data. They must show the way, give support and resources, and be a good example. Leaders should let their teams try new things, learn from them, and celebrate when things go well. Moreover, leaders break down silos by communicating the benefits of data integration, aligning strategies with collaborators, empowering teams with tools and training, and recognizing achievements to foster a collaborative and data-driven culture.
Integrating Cross-Channel Data into Marketing Dashboards
Here is a step-by-step guide on integrating data from various channels into a unified dashboard.
Step 1: Identify the data sources and the data destination
Find out where your data comes from and where it's going. Start by listing where your data comes from, like Google Analytics, Facebook Ads, Mailchimp, and Shopify.
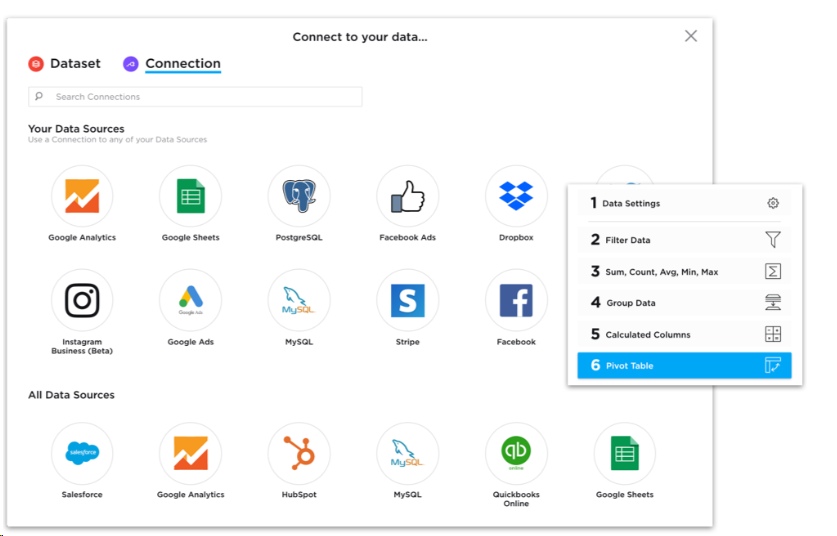
Then, decide where you want to see and analyze this data – it's usually a dashboard software like Grow. Make a list of these sources and destinations to plan your integration and pick the best Dashboard tool for you.
Step 2: Set Clear Integration Objectives
Set integration objectives by defining key performance indicators (KPIs) such as conversions, revenue, and cost per acquisition. Establish specific goals aligned with your overall business objectives and marketing strategy, focusing on metrics that truly matter. This ensures a streamlined approach, preventing overwhelm with irrelevant or redundant data.
Step 3: Choose the right dashboard software
Select dashboard software that aligns with your cross-channel data integration needs, such as a Marketing Reporting dashboard, Sales team dashboard, finance dashboard, etc. Look for features like broad connectivity to diverse data sources, support for various formats, and compatibility with native and third-party platforms. Prioritize options offering a free trial or demo for evaluating functionality and usability before making a purchase decision.
Step 4: Data Collection & Aggregation
In this step, use your Marketing Reporting dashboard software's automated API integrations or built-in connectors to import and sync data from various sources to your data destination. Follow software instructions to connect, authorize data access, and select parameters like date range and granularity. The Dashboard tool will automatically collect and aggregate data in its warehouse, ensuring quality, security, and reliability.
Step 5: Cleanse and Normalize
In this stage, clean up and standardize the data in your warehouse using the functionality of dashboard software. Remove errors, duplicates, and inconsistencies by addressing missing or invalid values, merging duplicates, and standardizing formats. Convert incompatible data types, split or combine fields for optimal granularity, and clarify by renaming or reordering columns. This Data Management Software enhances data quality, accuracy, and facilitates seamless integration and analysis.
For example, a retail chain tracks sales across various platforms. Using data management software as your data conductor, it swiftly cleans and normalizes sales figures in real-time, ensuring accuracy. Capitalize on this clean data to analyze trends, optimize inventory, and launch targeted marketing campaigns for maximum impact.
Step 6: Integration and Transformation
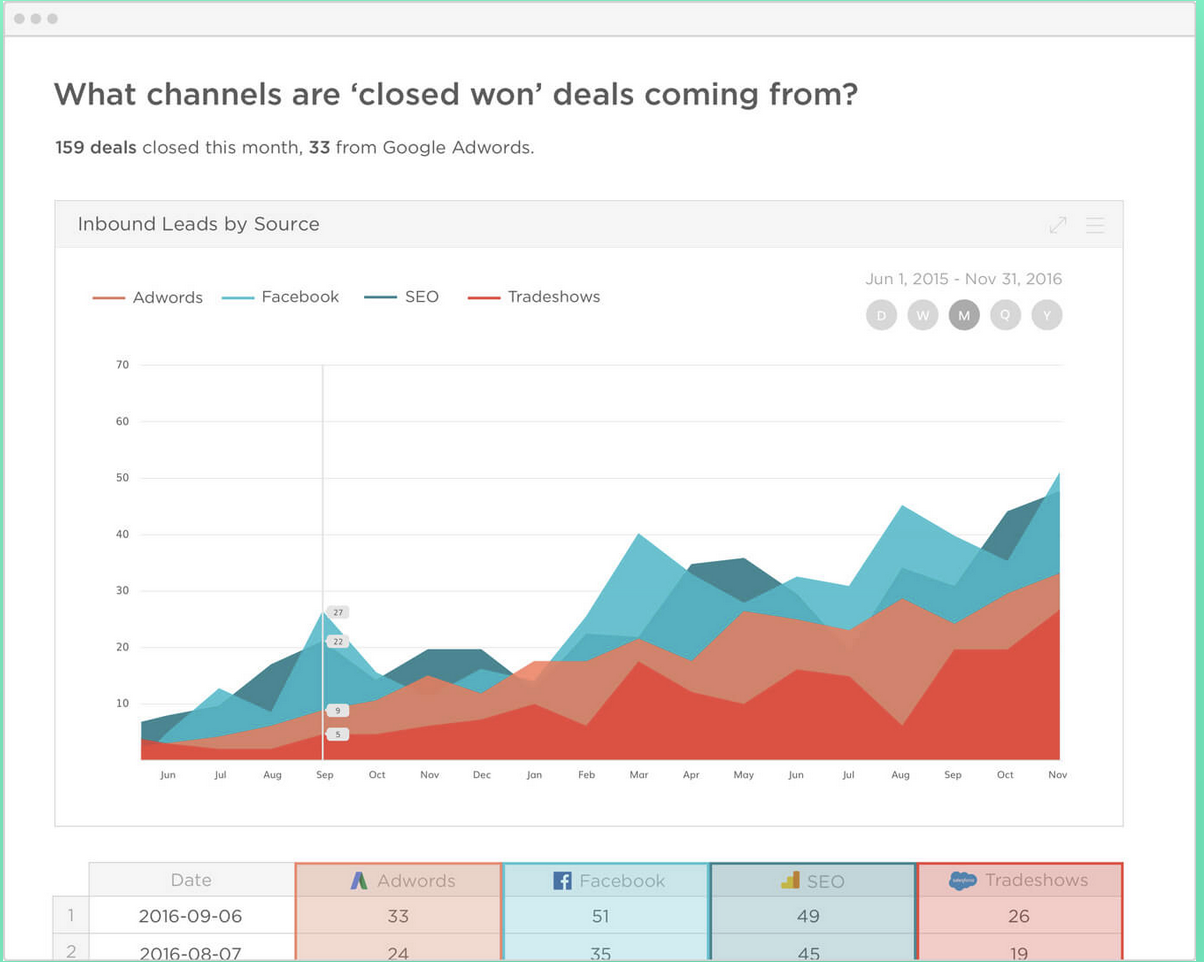
This stage involves leveraging the functionality of the dashboard tool to combine and modify data inside the data warehouse. Merge data from various sources, applying logic, calculations, and formulas for meaningful insights.
Moreover, the best Business Intelligence dashboards incorporate techniques like joining data based on common keys, filtering and sorting based on criteria, grouping or aggregation based on dimensions, and calculating new metrics. This process enables a unified view of marketing performance, facilitating the generation of valuable insights and tracking of key performance indicators and goals.
Step 7: Designing the dashboard
In this last stage, personalize your Marketing Reporting dashboard using the design and visualization features of the dashboard.
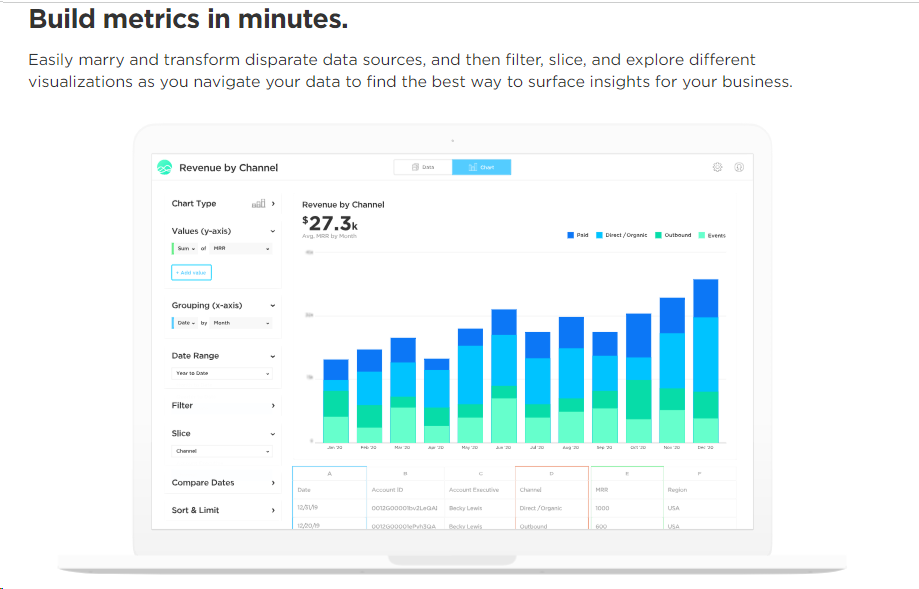
Choose suitable chart types (e.g., line, bar, pie, funnel) and optimize the color scheme for visual appeal and readability. Add or edit labels, titles, legends, axes, and annotations to clarify data and insights. Arrange and resize elements for an optimal layout. Employ techniques such as grid alignment to enhance the space efficiency of your dashboard.
Additional Steps
Implementation and Testing: Set up and test your marketing Dashboard tool for functionality, accuracy, and performance. Verify data sources, destinations, and warehouses and assess speed, reliability, and security.
Training and Rollout: Conduct training sessions, provide user resources, and gather feedback. Roll out the Marketing Reporting dashboard to your audience, communicating its purpose and benefits.
On-going maintenance and optimization: Regularly update and audit your marketing dashboard. Monitor performance, gather user feedback, and make enhancements based on evolving needs and goals.
Conclusion
Leverage cross-channel data for seamless marketing integration. Break down data silos, enhance customer understanding, and craft impactful cross-channel campaigns. Define goals, segment the audience, choose optimal channels, create engaging content, measure performance, and optimize campaigns.
One of the best business intelligence dashboards that meets all these criteria and more is Grow. You can experience seamless cross-channel data integration with Grow, a leading dashboard software. With over 75 connectors, Grow.com offers a 14-day free trial, an intuitive interface, a robust data warehouse, powerful data cleansing, a dynamic data pipeline, and a customizable dashboard builder.
Elevate your marketing insights with Grow user-friendly and feature-rich solutions. Don't believe in your word—explore Grow reviews from verified users on Grow.com Reviews & Ratings 2023 TrustRadius.

Comments
Post a Comment